
This post builds on “Marketing Attribution Explained,” where we covered the fundamentals. Here, we focus on application.
This post is the next step: a practical walkthrough of building a flexible multi-touch attribution framework using synthetic data — with examples you can adapt whether you’re optimizing for revenue, pipeline, demos, trials, or any other KPI.
- How to structure customer journeys for attribution (even if your data isn’t perfect yet)
- How rule-based models differ from data-driven models in practice
- How to run attribution when revenue is unavailable
- What “good” insights look like when you bring results back to stakeholders
1. The Dataset
To keep the mechanics clear, this walkthrough uses a synthetic dataset of 5,000 customer journeys.
Each journey includes a sequence of marketing touchpoints leading to a conversion outcome, and (in some scenarios) a revenue value. The data is meant to resemble common data organizations would have access to via their CRM, ad platforms, and analytics tools.
The point isn’t the exact numbers — it’s demonstrating a framework you can re-run on your own data once your tracking is in a good place.
Use our free diagnostic tool to check your data health before building models.
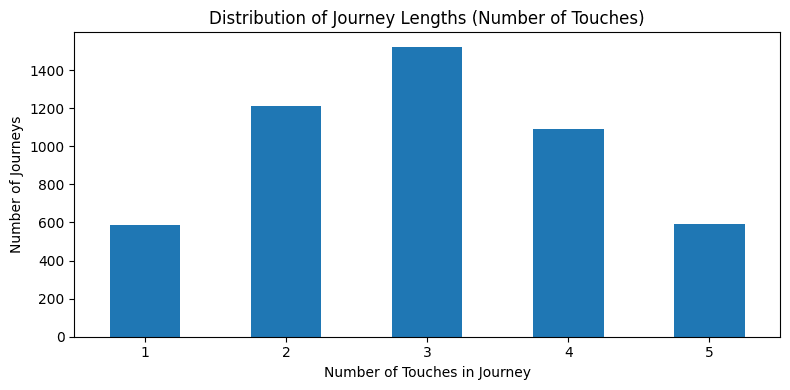
Why this matters: if most journeys include multiple touches, single-touch reporting will almost always overweight “closer” channels and undervalue early influence.
With a realistic dataset in place, we can now apply different attribution models to the same journeys and see how the story changes.
2. The Models
In the intro post, we covered what each attribution model is and how to think about them. Here, we’ll apply a set of models to the same dataset so you can see how the story changes based on the method you choose.
2.1 Rule-Based Models
Rule-based models are fast, explainable, and a great starting point — especially when you’re still cleaning up data. They don’t “learn” from behavior; they apply a consistent rule to every journey.
- First-touch (who started the conversation?)
- Last-touch (who closed it?)
- Linear (equal credit across touches)
- Time decay (more credit to recent touches)
- Position-based / U-shape (emphasis on first + last, shared middle)
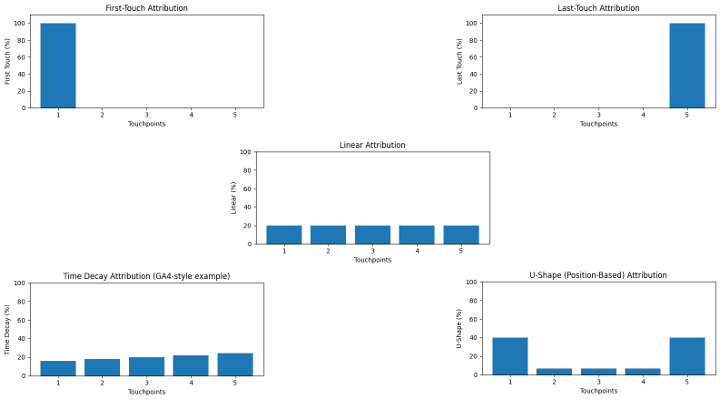
At this stage, we’re intentionally staying channel-agnostic. The goal is to build intuition for how each rule distributes credit across a journey — before we jump into which channels “won.”
2.2 Data-Driven Models
Data-driven attribution uses observed journeys to infer contribution. These models typically require cleaner data, adequate volume, and consistent identity stitching — but they can be far more revealing than a single rule.
- Markov (Removal Effect): Estimates impact by measuring how conversion probability changes if a channel is removed from the journey paths.
- Shapley Value: Distributes credit fairly across all channel combinations by averaging each channel’s marginal contribution across permutations.
- Regression-based approaches: Quantify which channels/features correlate with outcomes while controlling for other variables.
- Bayesian / probabilistic approaches: Model contribution under uncertainty and update beliefs as new data arrives.
A key note: “data-driven” doesn’t automatically mean “perfect.” It means the model is using your observed paths to infer contribution — and those inferences are only as reliable as your tracking.
3. Results When Revenue Exists
When revenue is available and reliably tied back to the marketing journey, you can assign credit in revenue terms. This is ideal for ecommerce and for B2B orgs with clean opportunity and closed-won values in the CRM.
Here’s what we’re looking for in the output:
- Which channels consistently show up early vs. late in journeys
- Which models over- or under-weight “closer” channels
- Where data-driven methods diverge from rule-based assumptions
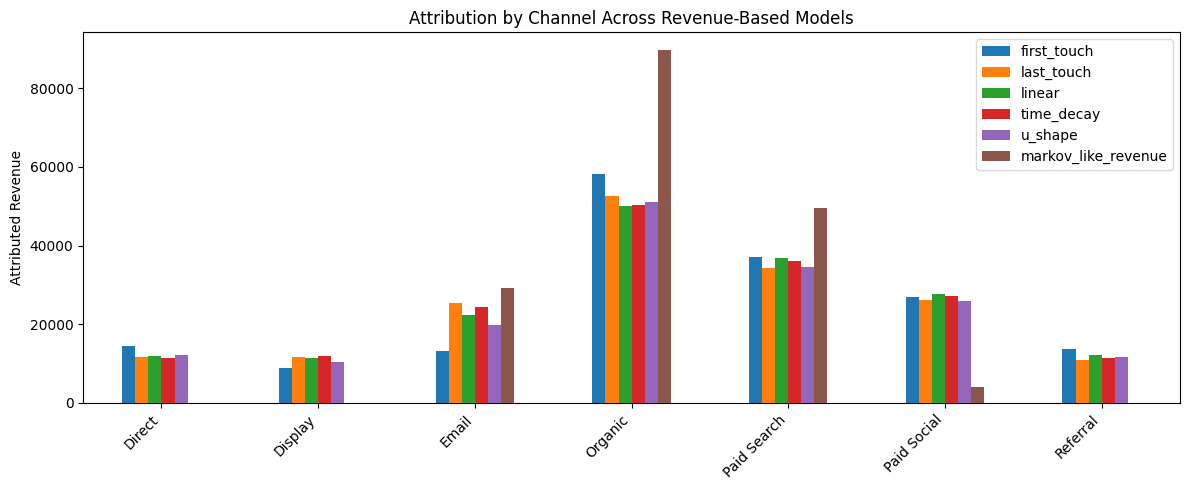
The most valuable conversations happen when you compare models side-by-side and ask: “Which story is most consistent with how our funnel actually works?”
4. Results When Revenue Doesn’t Exist
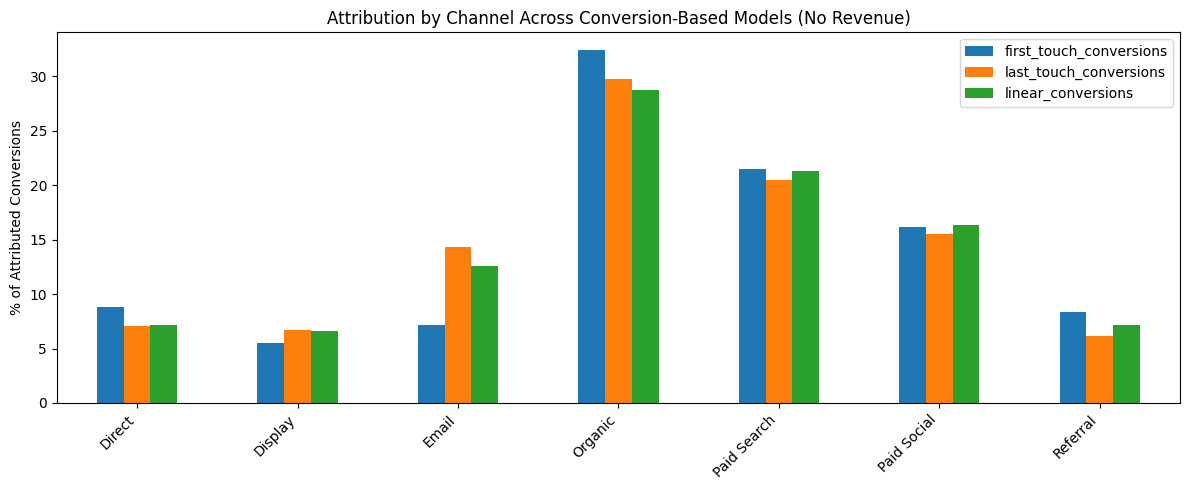
Many businesses can’t reliably tie revenue back to marketing touchpoints — at least not immediately. That doesn’t mean attribution is off the table.
Instead, you can assign credit to:
- Conversions (e.g., demo requests, sign-ups, trials)
- Pipeline stages (Lead → MQL → SQL → Opportunity → Closed Won)
- “Closed-won probability” style outcomes (especially helpful in B2B)
In practice, this often answers stakeholder questions more directly than revenue does: “Which channels create qualified demand?” versus “Which channel gets last-click credit?”
5. How to Present This to Stakeholders
Attribution lives or dies based on trust and clarity. When you present results, avoid dumping charts and calling it “the answer.” Instead, lead with a few grounded takeaways like:
- Budget allocation: “Paid Search closes, but doesn’t always create net-new demand.”
- Assists: “Email and Organic play a meaningful supporting role in multi-touch journeys.”
- Model comparison: “Rule-based models tell one story; data-driven models suggest another — here’s why.”
- Next tests: “Here’s what we should validate with an experiment or holdout.”
If your team isn’t ready for data-driven attribution, don’t force it. A simpler model used consistently is more valuable than a complex model no one trusts.
6. Practical Takeaways
- Start with directional insight, not perfection.
- Use multiple models to see bias, not truth.
- When possible, revenue is ideal, but conversions still tell a useful story.
- Consistency matters more than sophistication.
Have questions about multi-touch attribution?
King Data Lab helps teams build clean, trustworthy attribution and measurement — without overcomplicating it.