
Most HVAC business owners have a deep, intuitive understanding of their market. They know which neighborhoods keep their vans busy and which zip codes are home to their most loyal customers.
However, when it comes to prioritizing growth or exploring new territories, “gut feeling” can only take you so far. The challenge isn’t a lack of knowledge, it’s having too many options and not enough direction. By leveraging first-party operational data, we can move from general awareness to surgical precision.
- Identifying “Goldilocks” zones where revenue outpaces acquisition costs
- Visualizing the relationship between marketing spend and revenue generated by address served
- Creating a prioritized ranking of expansion opportunities by Zip Code
- Filtering out “high-noise” areas that drain budget with low return
1. The Visual Framework
Using a synthetic dataset mirroring the Chicago DMA, we built a clean, intuitive interface that categorizes market opportunities into three actionable tiers:
- Expand (Green): High-demand areas where your dollar goes furthest.
- Test / Optimize (Yellow): Steady markets that require efficiency tweaks.
- Deprioritize (Red): Areas where the cost of competition outweighs the likely return.
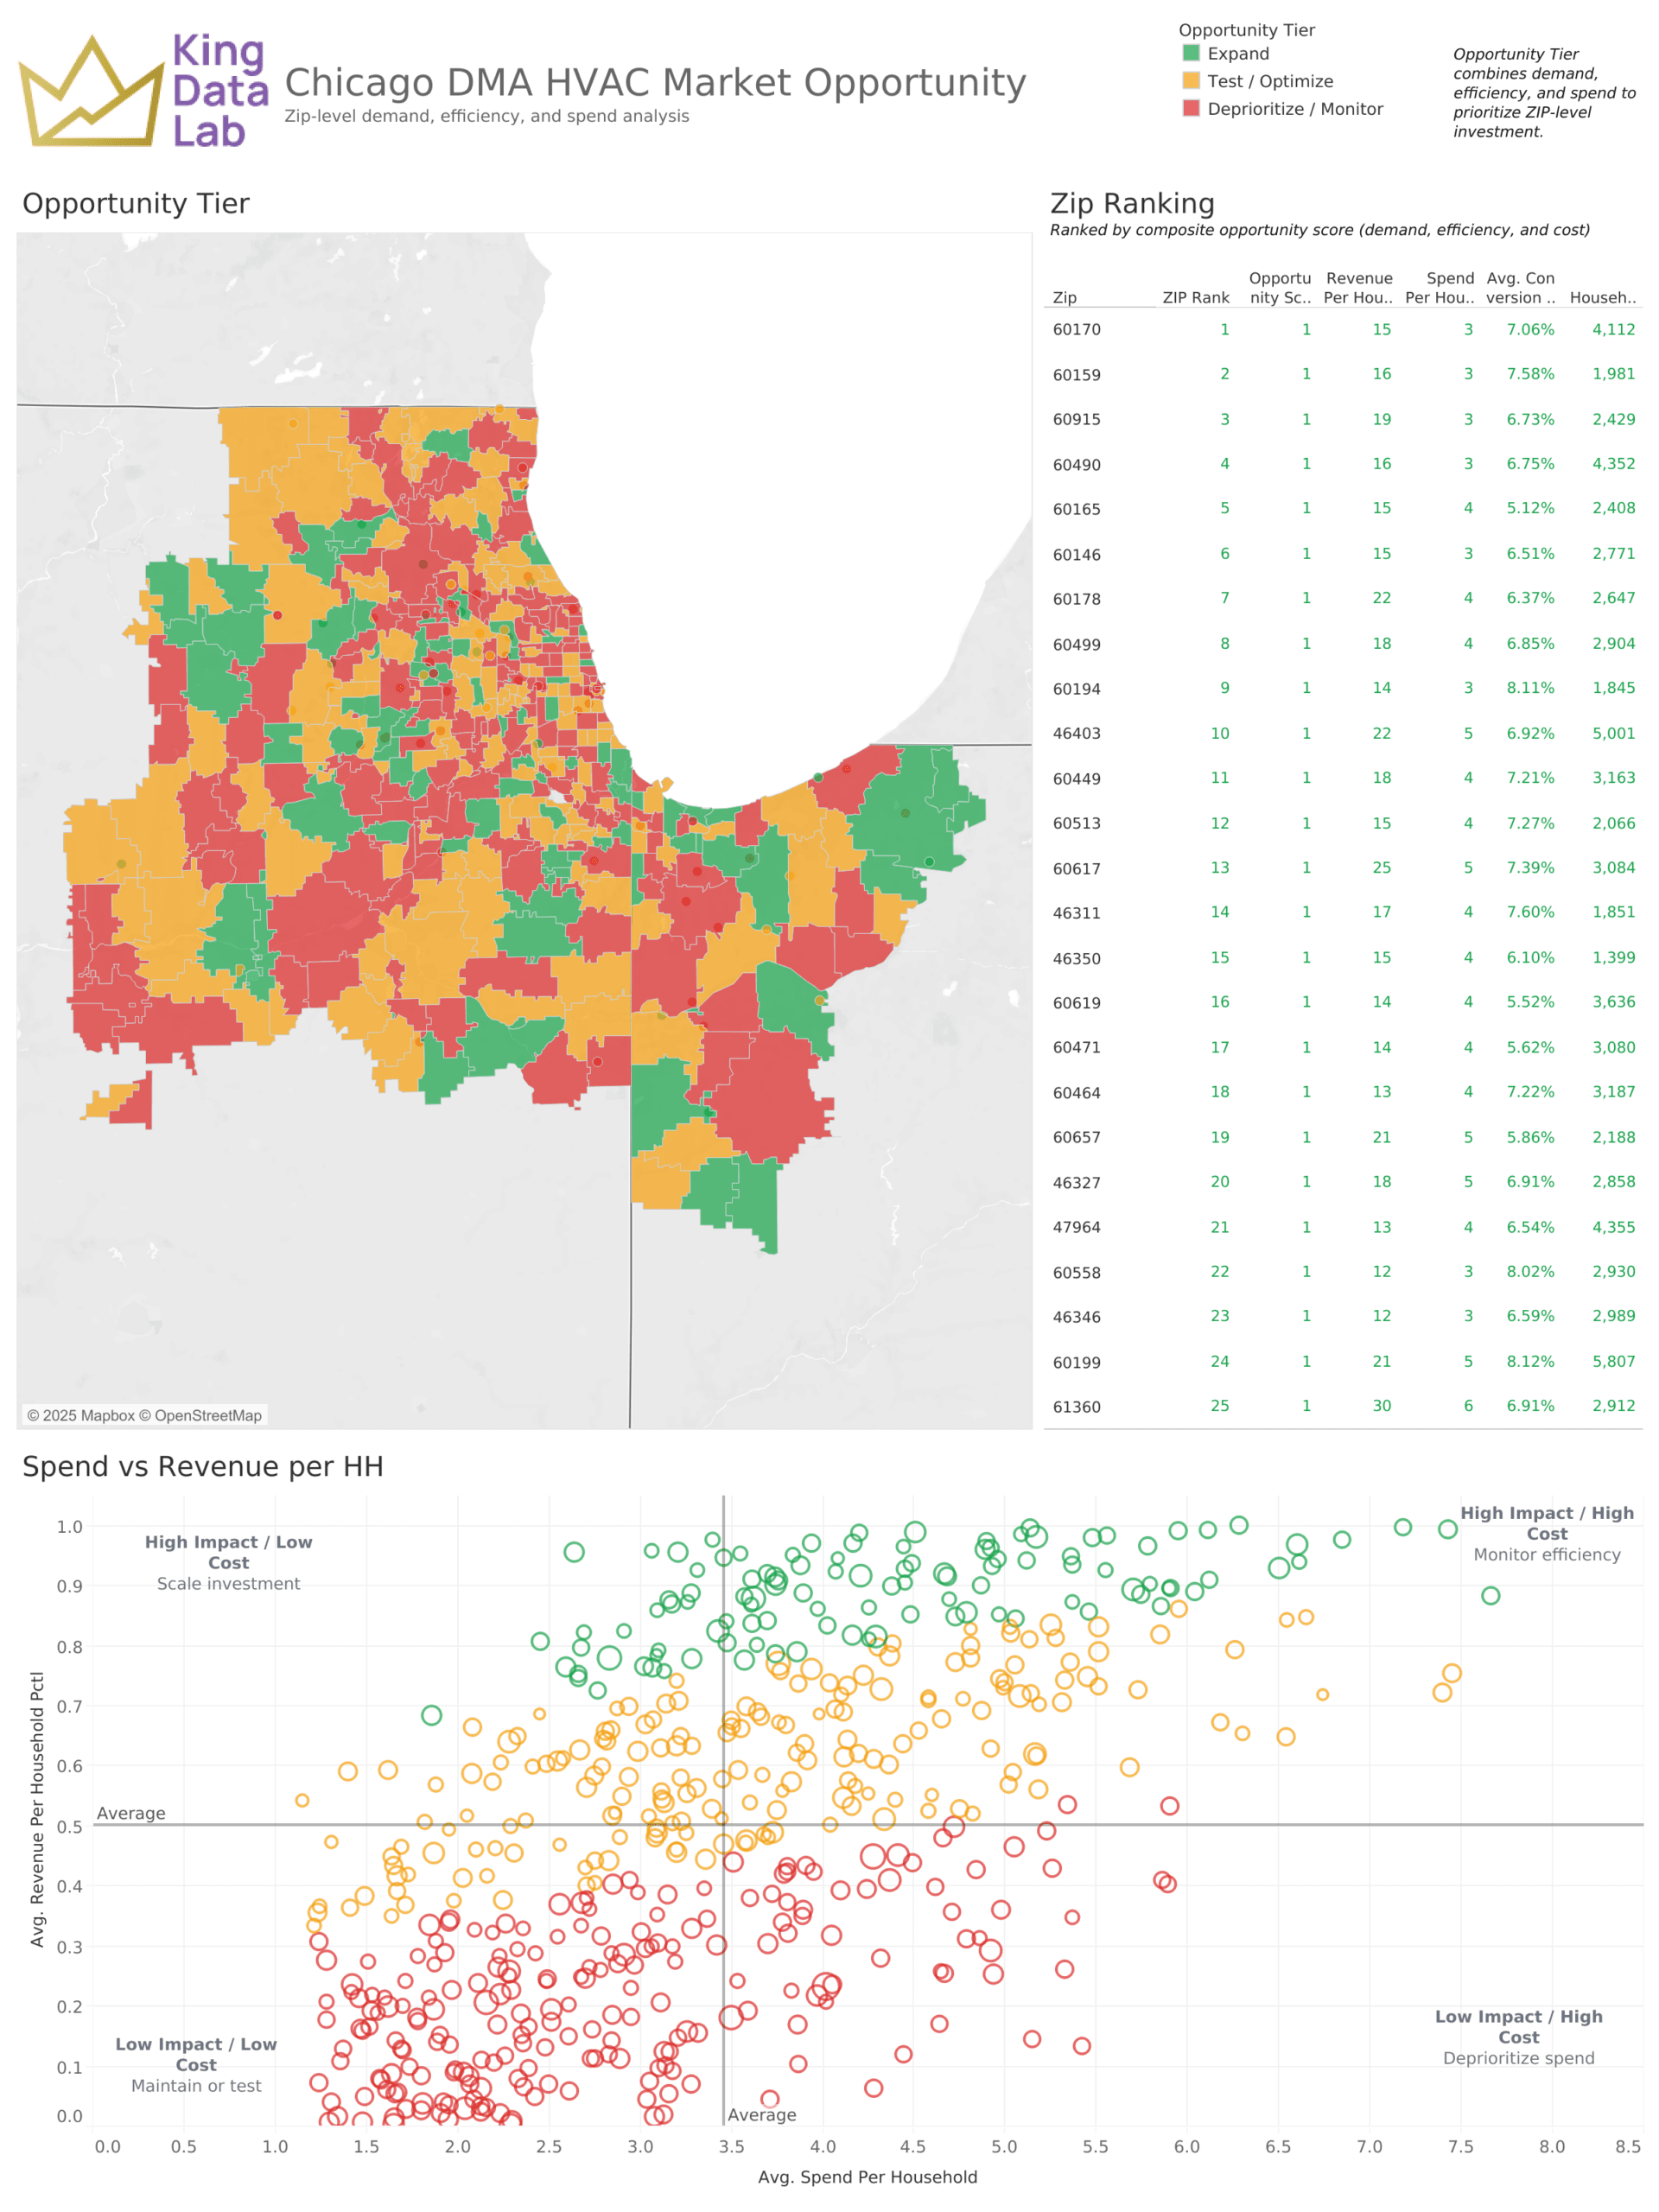
Figure 1: Spatial analysis of the Chicago DMA categorized by opportunity tier.
2. Balancing Spend vs. Revenue
The core of our prioritization engine lies in the Spend vs. Revenue per Household matrix. This scatter plot allows stakeholders to instantly see which Zip Codes are “High Impact / Low Cost” (top left quadrant).
By plotting these two variables against one another, we remove the guesswork. Instead of asking “should we be in this neighborhood?”, the data asks “is the revenue yield here worth the marketing spend required to capture it?” Additionally, the “we’ve always served this area” could be costing your business precious dollars and this type of dashboard provides the objective answers to formally hypothetical questions.
3. From Insights to Action
Data science is only as good as the action it inspires. For an HVAC operator, this dashboard serves as a weekly checklist for:
- Ad Spend Reallocation: Pulling budget from Red zips and pushing it into Green zips.
- Route Optimization: Focusing sales efforts in areas with higher conversion probabilities.
- New Market Entry: Identifying neighboring zip codes that share the characteristics of your current top-performing areas.
The goal isn’t to replace the business owner’s expertise—it’s to give that expertise a high-definition map to work with. And do it in a way that anyone can understand. A dashboard is only as good as the data populating it and if it provides actual value to the primary stakeholder using it.
Ready to see your own data on the map?
King Data Lab helps local service businesses turn their CRM and marketing data into clear, actionable growth strategies.